Custom reports are generated by a two step process:
- select the columns on the custom report page
- choose the rows by running a report
1. Go to the custom report page
Go to Insights › Custom reports ⤴.
2. Create a new report
Click the Add button.
Fill in a name for your report. If you want to be the only person who can see your report, tick ‘Make private’.
Click Save and continue editing.
3. Configure your report
Click Add columns to add columns to your report. Every available column for a product report is listed. Tick the columns you want to include, or fill in the filter to search for a column or columns (e.g. ‘isbn’).
Click Save.
The columns you have selected are displayed. Drag and drop a column to change the order it will appear on your report. You can add or remove columns at any time.
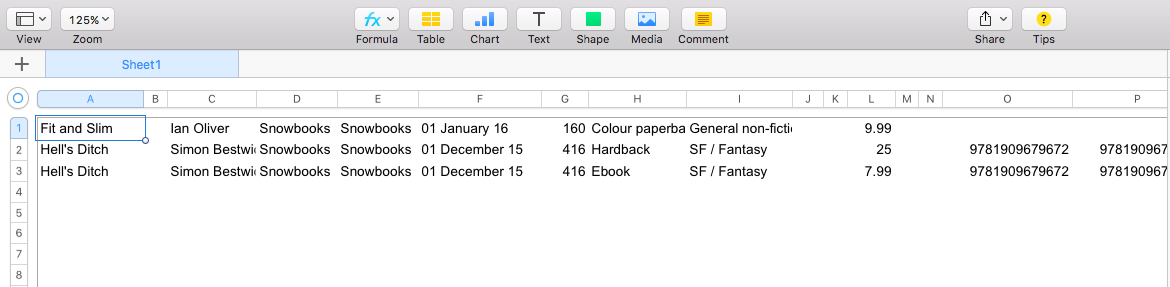
The page you are configuring defines the columns of your spreadsheet, but does not populate the rows. To confirm the selected columns are as expected, click Export sample to Excel to populate with some randomly selected records.
4. Run the report.
Select products to run the report on. You can do this by running a report, and then either view or export the results.
Go to Data Studio ⤴, and search to filter your selection (e.g. to within a range of publication dates).
5. View the report
Click Switch to…. Click View data lists › Product custom report. Choose the name of the custom report you created above from the dropdown.
Click View custom report.
Your report runs and is viewable on the page. Copy to clipboard or download to CSV.
6. Export the report
Click Switch to…. Click Create, edit and download in bulk › Download product custom report. Choose the name of the custom report you created above from the dropdown.
Click Run custom report for (n) products.
Your report runs in the background. Go to Notifications ⤴ to retrieve your report.